Increasing Page Speed – The Process
Page speed isn’t just about user experience anymore—it’s a critical ranking factor that directly impacts your bottom line. In 2025, with Core Web Vitals firmly established as ranking signals and users expecting instant loading times, understanding how to properly test, analyze, and optimize your site speed is non-negotiable.
This comprehensive guide will walk you through the best page speed tools available today, teach you how to read and interpret their results, show you how to identify the biggest performance killers, and provide actionable steps to fix them.
Important Note:
We specialize in performance optimization for WordPress and other major CMS platforms. While results vary by hosting environment and platform constraints, our team routinely delivers dramatic speed gains that directly impact SEO, user experience, and conversion rates. We’ve successfully improved load times on everything from small business sites to enterprise-level deployments — and we have the real-world proof to back it up. Get your site up to speed now!
If you’re not sure where the bottlenecks are, or don’t have the time or resources to fix them internally, let us do the heavy lifting. (We’ll even include a screenshot or audit comparison so you can see the difference for yourself.)
Why Page Speed Matters More Than Ever.
Before we dive into the tools, let’s understand what’s at stake. Google’s research consistently shows that as page load time increases from 1 to 10 seconds, the probability of a mobile user bouncing increases by 123%. Additionally:

- 53% of mobile users abandon sites that take longer than 3 seconds to load
- Page speed is a confirmed ranking factor for both mobile and desktop searches
- Core Web Vitals (LCP, FID, CLS) are now integral to search rankings
- E-commerce sites lose an average of $2.5 million annually for every second of load time
The good news? Most page speed issues are fixable once you know how to identify them.
Understanding Core Web Vitals: The Foundation of Page Speed.
Before using any tools, you need to understand what metrics matter:
Largest Contentful Paint (LCP) – Measures loading performance. Your LCP should occur within 2.5 seconds of when the page first starts loading.
Interaction to Next Paint (INP) – Replaced FID in 2024 as the Core Web Vital for interactivity. Measures how quickly your page responds to user interactions. Should be under 200ms.
Cumulative Layout Shift (CLS) – Measures visual stability. Your page should maintain a CLS of less than 0.1 to avoid annoying layout shifts as content loads.
Now let’s dive into the tools that measure these metrics and more.
The Essential Page Speed Testing Tools (Implementation Time Several Weeks of Testing)
1. Google PageSpeed Insights: Your Primary Diagnostic Tool
Why it’s essential: PageSpeed Insights (PSI) is the authoritative source for page speed data because it’s directly from Google. It uses real-world Chrome User Experience Report (CrUX) data and lab data from Lighthouse.
How to use it:
- Navigate to pagespeed.web.dev
- Enter your URL and click “Analyze.”
- Wait 30-60 seconds for the complete analysis
Understanding Your Results:
PSI provides two types of data:
Field Data (Real User Experience): This comes from actual Chrome users visiting your site over the past 28 days. If you see “No data available,” your site hasn’t received enough Chrome traffic yet. This is your most important metric because it reflects real-world performance.
Look for:
- Origin Summary: Shows how your entire domain performs
- Pass/Fail indicators for Core Web Vitals (green = good, orange = needs improvement, red = poor)
- Percentile data: Shows what percentage of users experience good, needs improvement, or poor loading times
Lab Data (Simulated Test): This is a controlled test using Lighthouse. It’s useful for debugging because it’s consistent and repeatable.
What to do with each score:
Green (90-100): Your page is well-optimized. Monitor regularly, but no urgent action is needed.
Orange (50-89): You have optimization opportunities. Prioritize the issues marked “Potential Savings” with the most significant time savings.
Red (0-49): Your site has serious performance issues that are likely hurting conversions and rankings. Address these immediately.
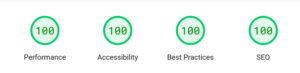
SEO Inc current scores:
Step-by-Step: Reading Your PageSpeed Insights Report
- Check your Core Web Vitals first – These are at the top. If any are red, they’re your top priority.
- Scroll to “Diagnose performance issues” – This section tells you exactly what’s wrong:
- Reduce unused JavaScript: Shows JS files that aren’t needed for initial page load
- Properly size images: Lists images that are larger than necessary
- Eliminate render-blocking resources: CSS/JS files are preventing your page from displaying
- Reduce unused CSS: Stylesheet code that’s not being used on this page
- Serve images in next-gen formats: Recommends WebP or AVIF instead of JPEG/PNG
- Prioritize by “Potential Savings” – Focus on items that save you the most time first. A 2-second savings is more valuable than a 0.1-second savings.
- Click the dropdown arrows – Each issue expands to show you exactly which files or elements are causing the problem.
Most Common Issues and How to Fix Them:
Issue: Render-blocking resources (most common)
- What it means: Your CSS and JavaScript files are preventing the page from displaying until they fully load
- How to fix:
- Inline critical CSS (CSS needed for above-the-fold content)
- Defer non-critical JavaScript with async or defer attributes
- Use a plugin like Autoptimize (WordPress) or WP Rocket
Issue: Unoptimized images
- What it means: Your images are too large in file size or dimensions
- How to fix:
- Use next-gen formats (WebP, AVIF)
- Implement lazy loading for below-the-fold images
- Use srcset for responsive images
- Compress images with tools like ShortPixel or Imagify
- Ensure images aren’t larger than their display size
Issue: Large JavaScript bundles
- What it means: You’re loading too much JavaScript code
- How to fix:
- Remove unused plugins or scripts
- Code-split your JavaScript bundles
- Use tree-shaking to eliminate dead code
- Load scripts only on pages where they’re needed
2. GTmetrix: Deep-Dive Performance Analysis
Why it’s valuable: GTmetrix provides detailed waterfall charts and video playback of your page loading, making it easier to see exactly what’s slowing you down.
How to use it:
- Go to gtmetrix.com
- Enter your URL
- Choose a test location closest to your target audience
- Click “Test your site”
Understanding Your GTmetrix Report:
Performance Score: A letter grade (A–F) based on Lighthouse metrics. Aim for at least a B.
Structure Score: How well your page follows best practices for performance. An A is ideal.
Web Vitals: Your LCP, CLS, and TLS (Total Blocking Time) scores.
Fully Loaded Time: Total time until all resources finish loading. Under 3 seconds is excellent, under 5 seconds is acceptable.
Total Page Size: The sum of all resources. Aim for under 2MB for optimal performance.
Requests: Number of HTTP requests. Fewer is better—aim for under 50 requests.
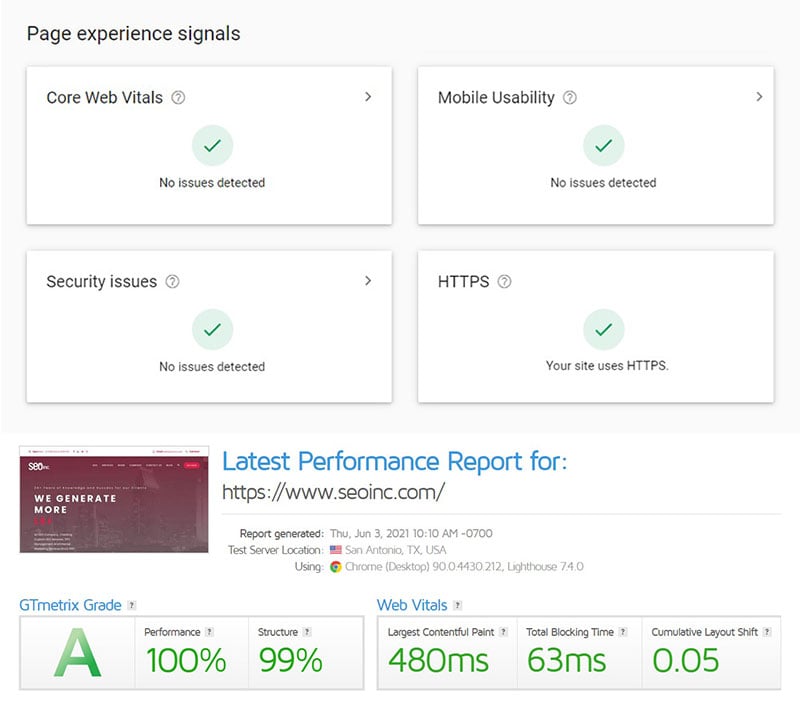
SEO Inc GTMetrix Scores:
Step-by-Step: Reading the GTmetrix Waterfall Chart
The waterfall chart is where GTmetrix truly shines. Here’s how to read it:
- Navigate to the “Waterfall” tab in your report
- Understand the color coding:
- Light green: DNS lookup time
- Orange: Connection time (establishing TCP connection)
- Purple: SSL/TLS negotiation
- Dark green: Time to first byte (TTFB) – server processing
- Blue: Content download
- Gray: Waiting time before download starts
- Read from top to bottom, left to right:
- The top item is your HTML document (usually index.html)
- Each subsequent line is a resource that the page requests
- The horizontal position shows when it loads in the timeline
- The length of the bar shows how long it takes to load
- Identify bottlenecks: Long DNS lookups (light green) indicate too many different domains. Reduce third-party resources or use DNS prefetching. Long TTFB (dark green): Server is slow to respond. Upgrade hosting, implement server-side caching, or use a CDN. Large blue bars: Files are too large. Compress images, minify CSS/JS, and enable gzip compression. Many parallel requests that suddenly stop (stair-step pattern): You’re hitting the browser’s connection limit. Combine files or use HTTP/2. Resources loading late in the waterfall: These might be render-blocking. Consider async loading or deferring them.
- Check the “Priority” column:
- High-priority resources are critical for rendering
- Low-priority resources can often be deferred
What to do after analyzing your waterfall:
- Fix your TTFB first – If your first bar (HTML document) has a long dark green section, your server is slow. This affects everything else.
- Identify heavy resources – Sort by size in the waterfall table. Any file over 500KB should be optimized or lazy-loaded.
- Look for third-party scripts – Resources from domains you don’t control (analytics, ads, fonts) often cause delays. Consider loading them asynchronously or removing unnecessary ones.
- Check for duplicate resources – Sometimes the same file loads multiple times. This is wasteful and should be fixed.
3. WebPageTest: Professional-Grade Testing
Why it’s powerful: WebPageTest offers the most advanced testing options, including multiple test runs, different device types, connection speeds, and geographic locations. It’s the industry standard for professional web performance testing.
How to use it:
- Navigate to webpagetest.org
- Enter your URL
- Choose your test location based on where your users are
- Select a browser (Chrome is the most common)
- Under “Advanced Settings”:
- Connection: Choose 4G, 3G, or Cable based on your audience
- Number of Tests: Set to 3 for reliable averages
- Repeat View: Check “First View and Repeat View” to see how caching helps
Understanding Your WebPageTest Results:
WebPageTest provides letter grades (A-F) for six key metrics:
First Byte Time (TTFB):
- A grade (< 200ms): Excellent server response
- F grade (> 1000ms): Serious server issues
- How to fix: Upgrade hosting, implement caching, optimize database queries
Keep-Alive Enabled:
- Tests if your server reuses connections
- F grade: Enable keep-alive in your server config (dramatically reduces connection overhead)
Compress Transfer:
- Checks if text resources are gzip/brotli compressed
- F grade: Enable compression in .htaccess or server config
- Can reduce HTML, CSS, and JS by 70-80%
Compress Images:
- Evaluates if images are optimized
- F grade: Images need compression
- Tools to fix: ShortPixel, Imagify, Squoosh.app
Cache Static Content:
- Checks if browser caching is configured
- F grade: Add cache-control headers
- Allows browsers to store and reuse resources
Effective Use of CDN:
- Checks if you’re using a Content Delivery Network
- X rating: Not applicable if you’re not using a CDN
- Consider: Cloudflare (free), KeyCDN, BunnyCDN
The Filmstrip View: Visualizing Your Load Experience
One of WebPageTest’s best features is the visual comparison:
- Click the “Filmstrip View” tab
- This shows screenshots at regular intervals (0.0s, 0.5s, 1.0s, 1.5s, etc.)
- Look for:
- How quickly your logo/branding appears
- When above-the-fold content becomes visible
- Any layout shifts as content loads
- When the page looks “complete” to users
Speed Index: The average time at which visible parts of the page are displayed. Under 3 seconds is good.
Step-by-Step: Using the WebPageTest Waterfall
WebPageTest’s waterfall is the most detailed available:
- Click the “Waterfall” view
- Understand the connection view (left side):
- Each row represents one server connection
- Colored blocks show what’s loading on that connection
- Multiple connections to the same domain indicate HTTP/1.1 parallelization
- Read the request timeline (right side):
- DNS Lookup: Time to resolve the domain to IP
- Initial Connection: TCP handshake
- SSL Negotiation: HTTPS setup
- Time to First Byte: Wait time for server response
- Content Download: Actual transfer time
- Identify the critical rendering path:
- Look for the solid orange line on the timeline
- This is “Start Render” – when content first appears
- Everything loaded before this line is delaying your users from seeing the content
- Your goal is to move this line as far left (earlier) as possible
- Find render-blocking resources:
- Look for CSS and JavaScript files loading before the orange “Start Render” line
- These are preventing your page from displaying
- Solutions: inline critical CSS, defer non-critical JS
- Check resource priorities:
- Click on any resource to see detailed timing
- Check the “Priority” field
- High-priority resources should load early; low-priority resources should load late
What to do after your WebPageTest analysis:
- Compare First View vs. Repeat View:
- Large difference = caching is working well
- Small difference = improve your cache headers
- Check your 3-run median results:
- This smooths out network fluctuations
- Use median, not average, for accurate results
- Test from multiple locations:
- If you serve global audiences, test from several continents
- Large variations indicate you need a CDN
4. Chrome DevTools: Built-In Real-Time Analysis
Why it’s essential: Chrome DevTools is free, always available, and provides real-time performance monitoring while you develop.
How to use it:
- Open your website in Chrome
- Press F12 (or Ctrl+Shift+I on Windows, Cmd+Option+I on Mac)
- Click the “Lighthouse” tab
- Select “Performance” and “Mobile” or “Desktop”
- Click “Analyze page load”
Understanding Chrome DevTools Lighthouse:
You’ll get the identical Core Web Vitals scores as PageSpeed Insights, but with the ability to:
- Test while making changes (no need to deploy)
- Simulate different devices and network speeds
- Profile JavaScript execution
- Identify memory leaks
Using the Performance Tab for Advanced Analysis:
- Click the “Performance” tab in DevTools
- Click the record button (circle) or Ctrl+Shift+E
- Reload your page or interact with it
- Stop recording after page load completes
You’ll see:
Frames per second (FPS): Should stay above 60 FPS. Dips indicate jank.
Main thread activity: Shows what’s blocking your page:
- Yellow bars: JavaScript execution
- Purple bars: Rendering and painting
- Green bars: Painting
- Long tasks (red triangles) are problems – they block user interaction
Network timeline: Similar to waterfall charts in other tools
Step-by-Step: Finding Performance Bottlenecks in DevTools
- Look for red triangles – These indicate long tasks (>50ms) that block the main thread
- Click on a yellow section to see which JavaScript function is running
- You can see exactly which code is slow
- Consider optimizing, code-splitting, or deferring that script
- Check the “Bottom-Up” tab to see which functions consumed the most time
- Sort by “Self Time” to find the true culprits
- These are your optimization priorities
- Use the Coverage tab:
- Ctrl+Shift+P → type “Coverage” → Enter
- Click the record button and reload
- Shows unused CSS and JavaScript
- Red bars = unused code you’re loading unnecessarily
5. Pingdom: Quick Performance Checks
Why it’s useful: Pingdom provides a simple, fast interface for regular monitoring and quick checks.
How to use it:
- Visit tools.pingdom.com
- Enter your URL
- Select test location
- Click “Start Test”
Understanding Your Pingdom Report:
Performance Grade (0-100): Overall score. Aim for 85+.
Page Size: Total size of all resources. Under 2MB is ideal.
Load Time: Total time to load all resources. Under 3 seconds is good.
Requests: Number of HTTP requests. Fewer is better.
Pingdom’s Content Analysis:
Pingdom breaks down your page into content types:
- Images: Usually the largest portion. Should be optimized.
- JavaScript: Second-largest typically. Minimize and defer.
- CSS: Should be small. Remove unused styles.
- Fonts: Limit to 2-3 font families maximum.
- HTML: Should be small unless you’re loading large amounts of text.
What to do with Pingdom results:
- Check “Load time” for each resource in the file requests section
- Sort by size to find your heaviest resources
- Look for resources over 100KB – these are optimization candidates
- Check for external resources (different domains) that are slow
The Most Common Page Speed Killers and How to Fix Them
1. Unoptimized Images (Responsible for 50-70% of page weight)
The problem: High-resolution images straight from cameras or design tools
The fix:
- Use WebP or AVIF format (80% smaller than JPEG with same quality)
- Compress all images before uploading (use TinyPNG, ShortPixel, or Squoosh)
- Implement lazy loading for images below the fold
- Use responsive images with srcset
- Ensure images aren’t larger than their display container
Tools: ShortPixel, Imagify, Squoosh.app, Adobe Express (free)
2. Render-Blocking CSS and JavaScript
The problem: CSS and JS files that must load before the page displays
The fix:
- Inline critical above-the-fold CSS in the HTML
- Load non-critical CSS asynchronously
- Add async or defer attributes to JavaScript:
async: Downloads in parallel, executes as soon as readydefer: Downloads in parallel, executes after HTML parsing
- Remove unused CSS with tools like PurgeCSS
Implementation:
<!-- Critical CSS inlined -->
<style>
  /* Your above-the-fold CSS here */
</style>

<!-- Non-critical CSS loaded async -->
<link rel="preload" href="styles.css" as="style" onload="this.onload=null;this.rel='stylesheet'">

<!-- JavaScript deferred -->
<script src="script.js" defer></script>
3. Slow Server Response Time (TTFB)
The problem: Server takes too long to generate and send the initial HTML
The fix:
- Upgrade to better hosting (consider VPS or managed WordPress hosting)
- Implement server-side caching (Redis, Memcached)
- Use a CDN to reduce distance between server and user
- Optimize database queries (add indexes, remove unnecessary queries)
- Enable OPcache for PHP
Recommended hosts: WP Engine, Kinsta, Cloudways, DigitalOcean
4. Too Many HTTP Requests
The problem: Each resource requires a separate request, creating overhead
The fix:
- Combine multiple CSS files into one
- Combine multiple JavaScript files (but balance with code-splitting)
- Use CSS sprites for small images and icons
- Use icon fonts or SVG sprites instead of multiple image files
- Implement HTTP/2 or HTTP/3 (allows parallel loading)
- Remove unnecessary plugins and third-party scripts
5. Lack of Browser Caching
The problem: Browsers re-download resources on every visit
The fix: Add cache-control headers to your .htaccess file, Or use your functions.php file if not using the .htaccess file
<IfModule mod_expires.c>
  ExpiresActive On
  ExpiresByType image/jpg "access plus 1 year"
  ExpiresByType image/jpeg "access plus 1 year"
  ExpiresByType image/gif "access plus 1 year"
  ExpiresByType image/png "access plus 1 year"
  ExpiresByType text/css "access plus 1 month"
  ExpiresByType application/pdf "access plus 1 month"
  ExpiresByType text/javascript "access plus 1 month"
  ExpiresByType application/javascript "access plus 1 month"
  ExpiresByType application/x-javascript "access plus 1 month"
</IfModule>
6. Unoptimized Web Fonts
The problem: Custom fonts can delay text rendering (FOIT/FOUT)
The fix:
- Limit to 2-3 font families maximum
- Use only the font weights and styles you need
- Implement font-display: swap in your CSS
- Self-host fonts instead of using Google Fonts
- Use variable fonts when possible (one file, multiple weights)
Implementation:
@font-face {
  font-family: 'Your Font';
  src: url('font.woff2') format('woff2');
  font-display: swap; /* Shows fallback font while loading */
}
7. Excessive Third-Party Scripts
The problem: Analytics, ads, chat widgets, and social media plugins slow your site down.
The fix:
- Audit all third-party scripts quarterly
- Remove scripts you’re not actively using
- Load third-party scripts asynchronously
- Use Google Tag Manager to control when scripts load
- Consider privacy-focused analytics (Plausible, Fathom) as lighter alternatives
8. Large JavaScript Bundles
The problem: Sending more JavaScript than users need for the current page
The fix:
- Code-split your JavaScript bundles
- Use dynamic imports for route-based splitting
- Tree-shake unused code with webpack or Rollup
- Remove unused dependencies from package.json
- Consider framework alternatives (Preact instead of React, etc.)
Your Step-by-Step Page Speed Optimization Workflow
Now that you understand the tools and common issues, here’s your systematic approach to improving page speed:
Week 1: Baseline and Quick Wins
- Test your site with PageSpeed Insights and GTmetrix
- Document your current scores (you’ll want to show improvement)
- Fix unoptimized images (usually the fastest improvement)
- Enable compression (gzip or brotli)
- Set up browser caching
- Retest and document improvements
Week 2: Rendering Optimization
- Identify render-blocking resources in PageSpeed Insights
- Inline critical CSS
- Defer non-critical JavaScript
- Implement lazy loading for images and iframes
- Remove unused CSS with PurgeCSS or similar tool
- Retest and measure impact
Week 3: Advanced Optimization
- Analyze waterfall charts in GTmetrix or WebPageTest
- Audit third-party scripts – remove unnecessary ones
- Implement a CDN if you haven’t already
- Optimize web fonts
- Consider server upgrade if TTFB is still high
- Run tests from multiple locations
Week 4: Monitoring and Refinement
- Set up continuous monitoring (Pingdom, GTmetrix monitoring)
- Test on real devices (not just simulators)
- Check performance on 3G connections
- Review Core Web Vitals in Google Search Console
- Create a performance budget for future development
- Document your optimization process for future reference
Setting Performance Budgets for Long-Term Success
A performance budget prevents performance regression:
Example budgets:
- Total page size: 2MB maximum
- JavaScript bundle: 300KB maximum
- Largest image: 150KB maximum
- Time to Interactive: 3.5 seconds on 4G
- LCP: Under 2.5 seconds
- CLS: Under 0.1
Use tools like Lighthouse CI or SpeedCurve to enforce these budgets in your development workflow.
Monitoring: Don’t Let Performance Degrade
Optimization isn’t one-and-done. Sites naturally slow down over time as content and features are added.
Set up monitoring:
- Google Search Console – Check your Core Web Vitals report monthly
- GTmetrix monitoring – Free plan includes weekly automated tests
- Pingdom monitoring – Checks your site every 5 minutes (paid plans)
- Lighthouse CI – Automates performance testing in your deployment pipeline
Set up alerts for:
- Performance score drops below 80
- Load time exceeds 4 seconds
- Core Web Vitals move from “Good” to “Needs Improvement”
WordPress-Specific Optimization Tips
If you’re running WordPress (40%+ of the web), these tips will help:
Essential Plugins:
- WP Rocket – Best all-in-one caching and optimization (paid)
- Autoptimize – Free CSS/JS optimization
- ShortPixel – Automated image optimization
- Asset CleanUp – Disable CSS/JS on specific pages where they’re not needed
- Query Monitor – Identify slow database queries
What NOT to do:
- Don’t install multiple caching plugins (they conflict)
- Don’t use too many optimization plugins (ironic, but they slow you down)
- Don’t use page builders if speed is critical (Gutenberg is faster)
- Don’t install plugins without testing their performance impact
Recommended hosting for WordPress:
- WP Engine (managed WordPress, excellent performance)
- Kinsta (Google Cloud-based, very fast)
- Cloudways (affordable VPS with optimization)
Testing Mobile Performance
Remember: Google uses mobile-first indexing. Your mobile speed is more important than desktop.
Mobile-specific considerations:
- Test on actual devices, not just simulators
- Test on 3G connections (still common in many regions)
- Prioritize INP (interaction responsiveness)
- Keep total page size under 1.5MB for mobile
- Use responsive images with srcset
- Implement touch-friendly tap targets (48x48px minimum)
Tools for mobile testing:
- PageSpeed Insights (defaults to mobile)
- WebPageTest (choose mobile device in advanced settings)
- Chrome DevTools device simulator (F12 → toggle device toolbar)
- Real device testing with Chrome Remote Debugging
The Bottom Line: What Actually Moves the Needle
After testing thousands of sites, here’s what typically provides the biggest improvements:
High-impact optimizations (do these first):
- Image optimization and next-gen formats – 30-50% size reduction
- Enable compression – 70-80% reduction in text file sizes
- Implement a CDN – 40-60% faster load times for distant users
- Upgrade hosting – Can reduce TTFB by 70%+
- Remove unused plugins/scripts – 20-40% fewer requests
Medium-impact optimizations: 6. Defer non-critical JavaScript 7. Inline critical CSS 8. Lazy load below-the-fold content 9. Browser caching optimization 10. Reduce third-party scripts
Lower-impact optimizations (diminishing returns): 11. Minify CSS/JavaScript 12. Combine CSS files 13. Reduce DNS lookups 14. Optimize CSS delivery
Focus your energy where it matters most. A perfectly optimized image gallery will have more impact than perfectly minified CSS.
Almost there: Speed as a Competitive Advantage
In 2025, page speed isn’t just a technical metric—it’s a competitive advantage. Sites that load in under 2 seconds convert at twice the rate of sites that take 5 seconds.
The tools in this guide give you everything you need to:
- Measure your current performance accurately
- Identify specific bottlenecks
- Implement targeted fixes
- Monitor ongoing performance
Start with PageSpeed Insights for your baseline, use GTmetrix or WebPageTest for detailed waterfall analysis, and leverage Chrome DevTools during development. Focus on the high-impact optimizations first, particularly images and hosting.
Most importantly: test regularly, set performance budgets, and treat speed as a feature, not an afterthought.
Your users—and your rankings—will thank you.
Quick Reference Checklist:
✅ Test with PageSpeed Insights – get your Core Web Vitals baseline
✅ Optimize images – switch to WebP, compress, lazy load
✅ Enable compression and caching
✅ Fix render-blocking resources
✅ Choose quality hosting or implement a CDN
✅ Remove unused plugins and scripts
✅ Defer non-critical JavaScript
✅ Monitor performance monthly
✅ Set and enforce performance budgets
✅ Retest after every major change
Now go make your site faster. Every millisecond counts.
Important Note:
We specialize in performance optimization for WordPress and other major CMS platforms. While results vary by hosting environment and platform constraints, our team routinely delivers dramatic speed gains that directly impact SEO, user experience, and conversion rates. We’ve successfully improved load times on everything from small business sites to enterprise-level deployments — and we have the real-world proof to back it up. Get your site up to speed now!
If you’re not sure where the bottlenecks are, or don’t have the time or resources to fix them internally, let us do the heavy lifting. (We’ll even include a screenshot or audit comparison so you can see the difference for yourself.)